Principal Dashboard
Definition and Purpose
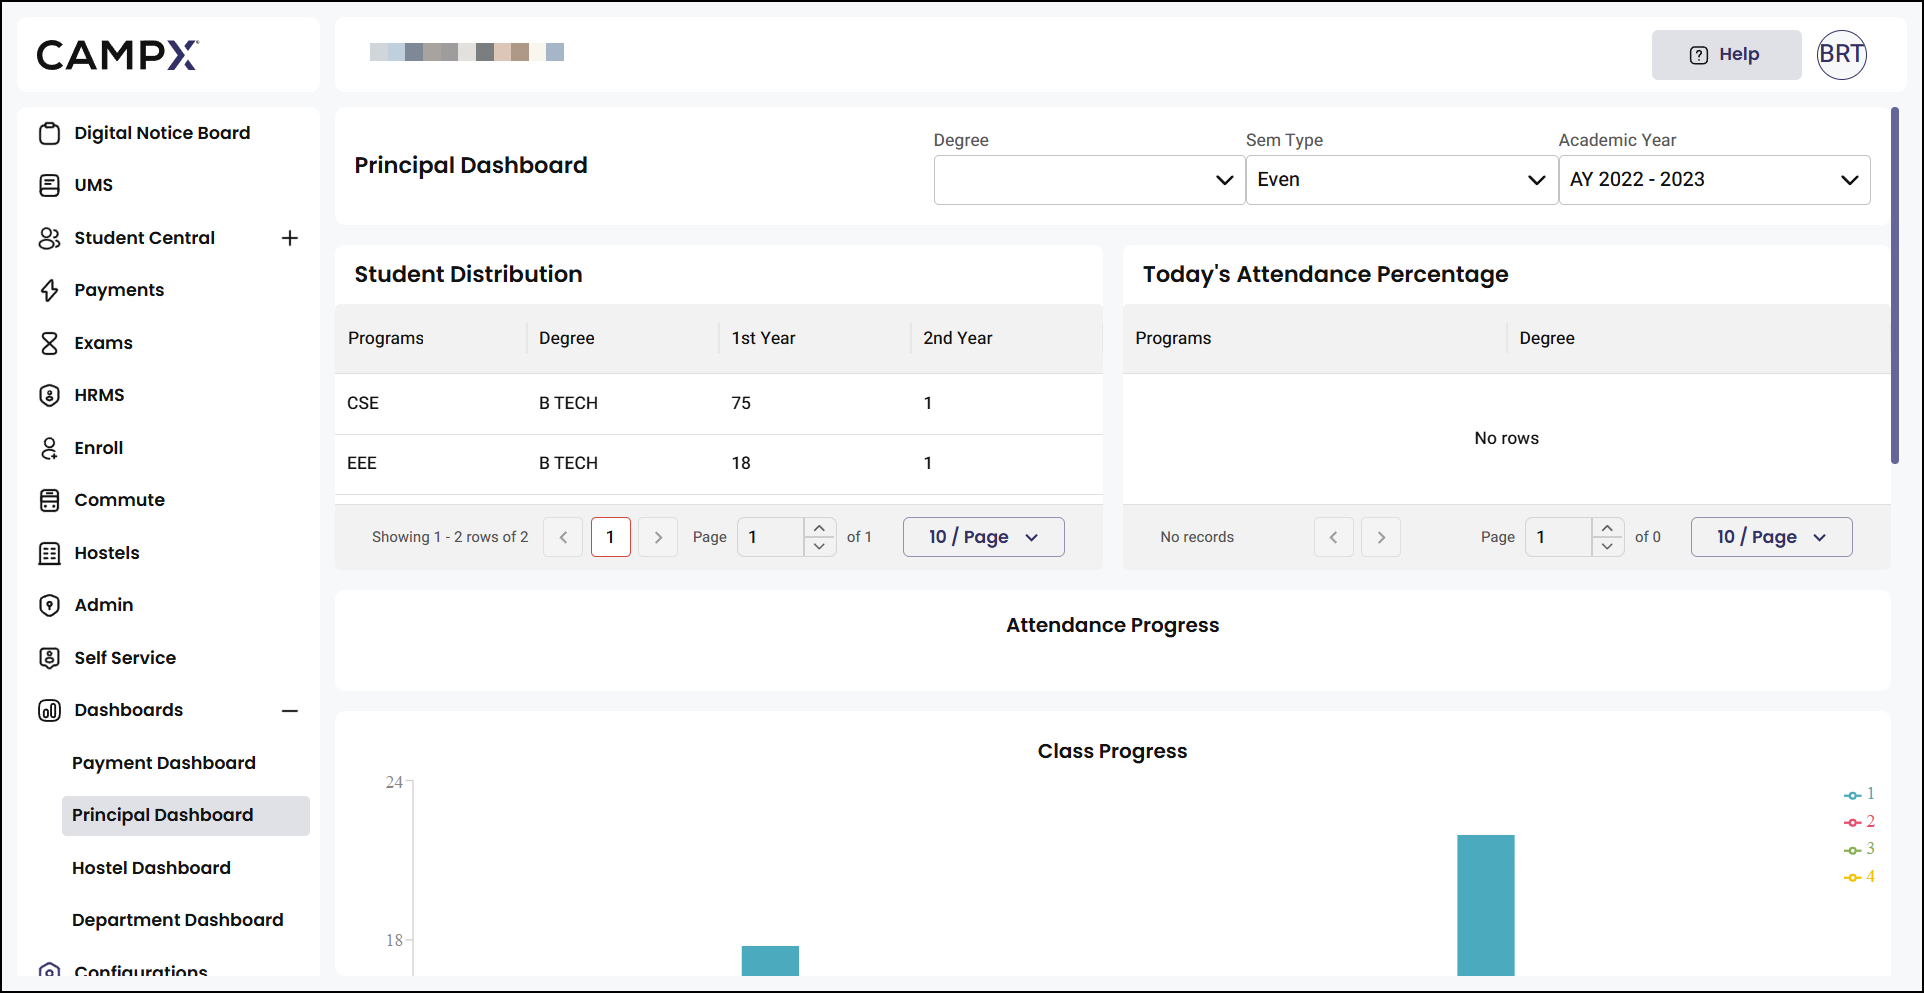
The Principal Dashboard within the Dashboards module is a comprehensive executive-level institutional overview and performance monitoring system that provides institutional leadership with high-level insights into overall academic performance, student metrics, and operational indicators. This module serves as the central platform for monitoring institutional effectiveness, tracking academic progress, analyzing student distribution patterns, and generating strategic reports for executive decision-making across all academic programs and administrative functions.
Dashboard Filter System
The Principal Dashboard features an executive-focused filtering interface that enables institutional-wide data analysis and strategic reporting:
Degree Filter
- Academic program-specific filtering for comprehensive program-wise institutional analysis.
- Supports multiple degree types and academic qualifications offered by the institution.
- Enables comparative analysis between different academic programs for strategic planning.
- Facilitates program-specific performance evaluation and resource allocation decisions.
Semester Type Filter
- Academic semester classification filtering with Even and Odd semester options.
- Provides insights into semester-specific performance patterns and trends.
- Enables comparison of institutional performance across different academic terms.
- Supports semester-based strategic planning and academic calendar optimization.
Academic Year Filter
- Multi-year filtering capability spanning multiple academic sessions for historical analysis.
- Supports long-term institutional performance tracking and trend identification.
- Enables year-over-year comparison of academic outcomes and institutional effectiveness.
- Facilitates strategic planning and institutional development goal setting.
Student Distribution Analytics
Comprehensive Student Enrollment Overview The dashboard displays detailed student distribution metrics through systematic tabular presentation:
Program-wise Student Distribution
- Systematic breakdown of student enrollment across different academic programs.
- Year-wise student distribution showing first-year and second-year enrollment patterns.
- Degree-specific enrollment tracking for comprehensive program analysis.
- Enables identification of enrollment trends and program popularity patterns.
Academic Year Distribution Analysis
- Comprehensive tracking of student progression through different academic years.
- First-year and second-year enrollment comparison for retention analysis.
- Program-specific year-wise distribution for academic planning purposes.
- Supports strategic enrollment management and capacity planning decisions.
Real-time Attendance Monitoring
Today's Attendance Percentage Dashboard
- Real-time institutional attendance tracking for immediate operational insights.
- Program-wise and degree-specific attendance monitoring capabilities.
- Daily attendance percentage calculation for institutional performance assessment.
- Enables immediate intervention planning for attendance-related concerns.
Attendance Progress Tracking
- Comprehensive attendance trend analysis across the institution.
- Visual representation of attendance patterns and institutional compliance rates.
- Progress tracking for attendance improvement initiatives and policies.
- Supports data-driven decision-making for attendance management strategies.
Academic Progress Visualization
Class Progress Analytics
- Visual representation of academic progress across different programs and classes.
- Bar chart visualization showing comparative progress between academic programs.
- Program-specific academic advancement tracking for performance evaluation.
- Enables identification of programs requiring additional academic support or resources.
Progress Comparison Interface
- Comparative analysis of academic progress between different institutional programs.
- Visual indicators for programs performing above or below institutional benchmarks.
- Trend analysis for academic improvement initiatives and educational effectiveness.
- Supports strategic academic planning and resource allocation decisions.
Examination Management Dashboard
Upcoming Exam Schedules Overview
- Comprehensive examination calendar and scheduling information display.
- Exam group organization and date-wise examination planning interface.
- Academic calendar integration for systematic examination management.
- Enables strategic planning for examination periods and resource allocation.
Exam Results Analytics
- Detailed examination performance tracking and analysis interface.
- Student performance metrics including total students, pass percentages, and failure rates.
- Exam group-specific performance analysis for academic quality assessment.
- Comprehensive examination outcome tracking for institutional effectiveness evaluation.
Performance Metrics Dashboard
- Statistical analysis of examination outcomes across different exam groups.
- Pass and fail rate calculations for academic performance benchmarking.
- Comparative analysis of examination results across different academic periods.
- Supports academic quality improvement initiatives and strategic planning.
Interactive Data Extraction
Mouse Hover Functionality
- Real-time data extraction capability through interactive dashboard elements.
- Hover-activated tooltips providing detailed information for specific metrics and data points.
- Enables precise institutional data analysis without navigating away from the executive dashboard.
- Supports quick data verification and detailed investigation of specific institutional metrics.
- Facilitates executive presentation preparation and strategic planning data sharing.
Using Dashboard Filters
Steps to Apply Dashboard Filters
- Navigate to Dashboards >> Principal Dashboard. This will open the comprehensive executive analytics interface with all available institutional filtering options.
- Select your desired Degree from the dropdown menu. This will filter all dashboard data to show information specific to your selected academic program.
- Choose the appropriate Sem Type filter to focus analysis on Even or Odd semester data. This will customize all visualizations to show semester-specific institutional performance.
- Set the Academic Year filter to focus on specific time periods for historical or current analysis. This will update all dashboard elements to display data for your chosen academic session.
- Review the updated dashboard metrics, charts, and summary tables that now reflect your selected executive filter criteria.
Interpreting Dashboard Analytics
Steps to Analyze Executive Dashboard Data
- Navigate to Dashboards >> Principal Dashboard. This will display the complete executive analytics interface with all institutional performance elements.
- Review the Student Distribution table to understand enrollment patterns across programs and academic years.
- Monitor the Today's Attendance Percentage section to assess current institutional attendance performance and compliance rates.
- Examine the Attendance Progress and Class Progress charts to identify institutional trends and program-specific performance patterns.
- Analyze the Upcoming Exam Schedules to understand examination planning and academic calendar coordination.
- Study the Exam Results section to evaluate institutional academic performance and identify areas requiring strategic attention.
- Use mouse hover functionality over chart elements and data points to extract detailed institutional metrics for executive reporting and strategic planning.
- Use multiple filters simultaneously to create highly targeted institutional analysis and identify specific trends requiring executive attention and strategic intervention.
- Monitor the Today's Attendance Percentage regularly to maintain awareness of daily institutional performance and enable immediate corrective actions when necessary.
- Leverage the Student Distribution analytics to inform enrollment planning, resource allocation, and program development decisions for institutional growth.
- Compare Class Progress visualizations across different programs to identify successful practices and areas requiring additional institutional support and resources.
- Use the Exam Results analytics to evaluate academic quality and institutional effectiveness, supporting data-driven improvements to educational outcomes.
- Utilize mouse hover functionality extensively to extract precise institutional data for board presentations, strategic planning sessions, and stakeholder reporting requirements.
Common Issues & Solutions
| 🔴 Issue | ✅ Solution |
|---|---|
| Dashboard shows incomplete data after filter selection | Ensure selected filter combination has available institutional data, try broader filter criteria or different academic periods |
| Data inconsistencies across different dashboard sections | Manual data entry processes and timing delays between different staff members updating related information can cause temporary mismatches - allow 15-30 minutes for system synchronization |
Implementing the Principal Dashboard creates a comprehensive executive intelligence system that transforms institutional data into strategic insights for leadership decision-making and operational excellence. By providing real-time student distribution analytics, attendance monitoring capabilities, academic progress visualization, and examination performance tracking, this dashboard enables institutional leaders to monitor overall performance, identify strategic opportunities, and make informed decisions that drive institutional effectiveness and educational excellence. The system's executive-focused filtering options, comprehensive academic analytics, and interactive data extraction capabilities ultimately create a powerful leadership tool where data-driven insights support strategic planning, resource allocation, and institutional development initiatives that enhance educational quality, operational efficiency, and long-term institutional success.