Payment Dashboard
Definition and Purpose
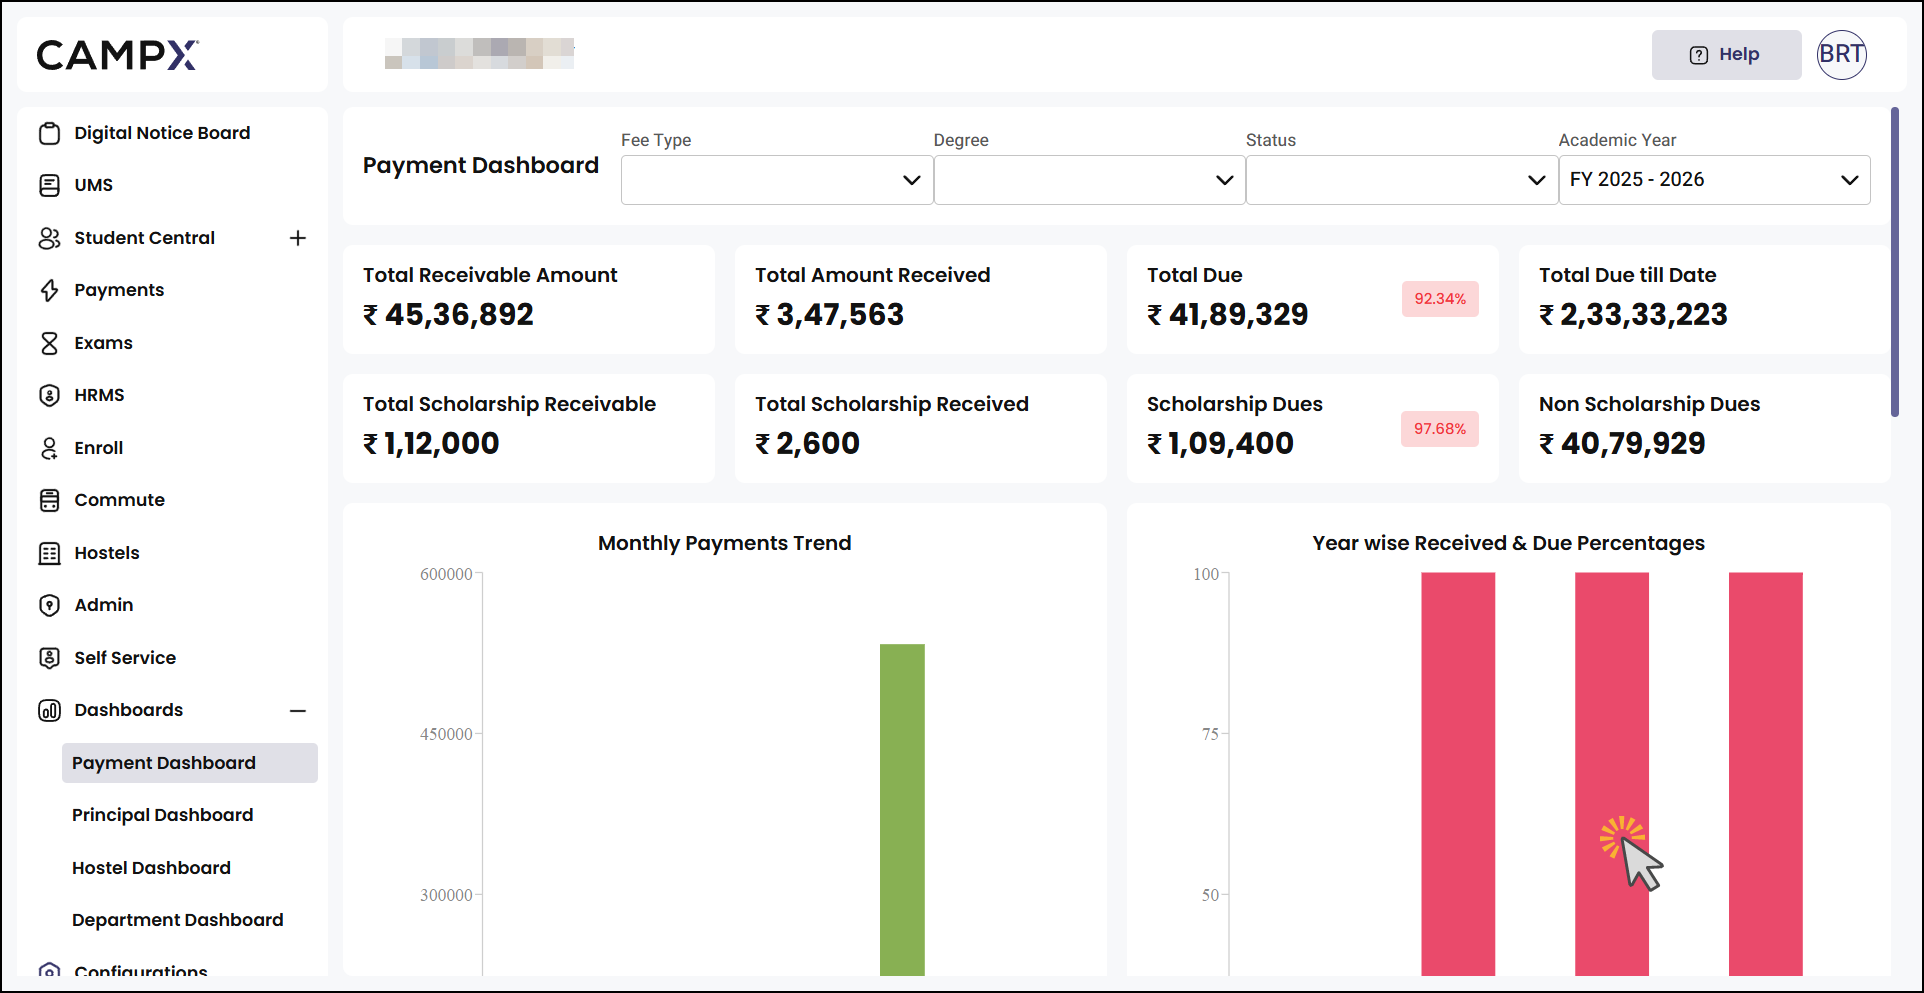
The Payment Dashboard within the Dashboards module is a comprehensive financial analytics and visualization system that provides administrators with real-time insights into institutional payment patterns, fee collection status, and student payment behaviors. This module serves as the central platform for monitoring financial metrics, tracking payment trends, analyzing scholarship distributions, and generating actionable reports for strategic financial planning and decision-making across all fee categories and academic programs.
Dashboard Filter System
The Payment Dashboard features a sophisticated filtering interface that enables customized data analysis and targeted reporting:
Fee Type Filter
- Comprehensive dropdown selection for specific fee categories.
- Includes multiple fee types such as tuition fees, admission fees, accommodation charges, transportation costs, examination fees, and miscellaneous charges.
- Enables focused analysis on specific revenue streams and fee collection patterns.
- Facilitates targeted financial reporting for different institutional departments.
Degree Filter
- Academic program-specific filtering for detailed program-wise analysis.
- Supports multiple degree types and academic qualifications offered by the institution.
- Enables comparative analysis between different academic programs.
- Facilitates program-specific financial planning and resource allocation decisions.
Status Filter
- Student enrollment status filtering with Active and Inactive options.
- Provides insights into payment patterns based on current student status.
- Enables analysis of financial obligations for continuing versus discontinued students.
- Supports strategic decision-making for student retention and financial planning.
Academic Year Filter
- Multi-year filtering capability spanning multiple academic sessions.
- Supports historical financial data analysis and trend identification.
- Enables year-over-year comparison of payment patterns and collection efficiency.
- Facilitates long-term financial planning and budget forecasting activities.
Financial Metrics Dashboard
Primary Financial Indicators
The dashboard displays key financial metrics through intuitive card-based interface:
Total Receivable Amount
- Comprehensive overview of total expected revenue across all fee categories.
- Provides institutional financial planning baseline for budget projections.
- Enables tracking of total financial obligations from student population.
Total Amount Received
- Real-time tracking of actual payments collected from students.
- Provides immediate insight into cash flow and collection efficiency.
- Supports financial planning and operational budget management.
Total Due Amount
- Outstanding payment obligations requiring collection follow-up.
- Critical indicator for financial risk assessment and collection strategies.
- Enables proactive financial management and student communication planning.
Total Due Till Date
- Cumulative overdue amounts requiring immediate attention.
- Provides insight into collection challenges and payment delay patterns.
- Supports strategic intervention planning for improved collection rates.
Scholarship Financial Tracking
Dedicated scholarship analytics providing transparent scholarship fund management:
Total Scholarship Receivable and Received
- Comprehensive tracking of scholarship fund allocation and distribution.
- Enables scholarship program effectiveness analysis and budget planning.
- Supports transparent scholarship fund management and reporting.
Scholarship Dues and Non-Scholarship Dues
- Separate tracking of scholarship-covered versus self-funded student obligations.
- Provides insights into scholarship program impact on overall financial collection.
- Enables targeted support strategies for different student financial categories.
Interactive Data Visualization
Monthly Payments Trend Analysis
- Line and bar chart visualization showing payment collection patterns over time.
- Identifies seasonal payment trends and collection peak periods.
- Supports strategic planning for collection activities and cash flow management.
- Enables identification of payment pattern anomalies requiring investigation.
Year-wise Received and Due Percentages
- Comparative analysis of payment collection efficiency across academic years.
- Visual representation of collection success rates and outstanding obligations.
- Facilitates year-over-year performance analysis and improvement planning.
- Supports strategic financial planning and target setting for collection activities.
Program-wise Financial Analytics
- Academic program-specific payment and collection analysis.
- Enables identification of programs with higher or lower collection rates.
- Supports program-specific financial planning and fee structure optimization.
- Facilitates targeted collection strategies based on program characteristics.
Fee Type-wise Financial Distribution
- Detailed breakdown of collection patterns across different fee categories.
- Identifies fee types with higher collection challenges or success rates.
- Supports fee structure optimization and collection strategy development.
- Enables category-specific financial planning and resource allocation.
Interactive Data Extraction
Mouse Hover Functionality
- Real-time data extraction capability through interactive chart elements.
- Hover-activated tooltips providing detailed information for specific data points.
- Enables precise data analysis without navigating away from the dashboard.
- Supports quick data verification and detailed investigation of specific metrics.
- Facilitates presentation preparation and data sharing with stakeholders.
Payment Summary Analytics
Comprehensive Student Payment Categorization
The Payment Summary table provides detailed student payment status breakdown:
Student Classification System
- Systematic categorization of students based on payment completion status.
- Separation between scholarship and non-scholarship student payment patterns.
- Comprehensive tracking across Total Paid, Partial Paid, and Not Paid categories.
Payment Status Tracking
- Total Paid Students: Complete fee payment verification and tracking.
- Partial Paid Students: Students with outstanding balance requirements.
- Not Paid Students: Students requiring immediate collection attention.
- Total Students: Comprehensive student population overview for complete institutional analysis.
Scholarship vs Non-Scholarship Analysis
- Separate tracking systems for scholarship recipients and self-funded students.
- Enables analysis of scholarship program effectiveness on payment collection.
- Supports targeted communication and support strategies for different student categories.
- Facilitates scholarship program evaluation and optimization planning.
Using Dashboard Filters
Steps to Apply Dashboard Filters
- Navigate to Dashboards >> Payment Dashboard. This will open the comprehensive payment analytics interface with all available filtering options.
- Select your desired Fee Type from the dropdown menu. This will filter all dashboard data to show information specific to your selected fee category.
- Choose the appropriate Degree filter to focus analysis on specific academic programs. This will customize all visualizations to show program-specific financial data.
- Set the Status filter to Active or Inactive based on your analysis requirements. This will adjust all metrics to reflect data for your selected student status category.
- Select the Academic Year from the dropdown to focus on specific time periods. This will update all dashboard elements to display data for your chosen academic session.
- Review the updated dashboard metrics, charts, and summary tables that now reflect your selected filter criteria.
Interpreting Dashboard Visualizations
Steps to Analyze Dashboard Data
- Navigate to Dashboards >> Payment Dashboard. This will display the complete financial analytics interface with all visualization elements.
- Review the financial metrics cards at the top of the dashboard. These provide immediate overview of key financial indicators and collection performance.
- Examine the Monthly Payments Trend chart to identify payment collection patterns and seasonal variations in student payment behavior.
- Analyze the Year-wise Received and Due Percentages chart to understand collection efficiency trends across different academic years.
- Study the Program-wise and Fee Type-wise charts to identify specific areas requiring attention or performing exceptionally well.
- Use mouse hover functionality over chart elements to extract detailed data points and specific metrics for deeper analysis.
- Review the Payment Summary table to understand student payment distribution and identify categories requiring focused attention.
- Use multiple filters simultaneously to create highly targeted financial analysis and identify specific trends or issues requiring attention.
- Regularly monitor the Monthly Payments Trend chart to identify seasonal patterns and plan collection activities accordingly for maximum effectiveness.
- Leverage the mouse hover functionality extensively to extract precise data points for presentations, reports, and strategic planning meetings.
- Compare Program-wise and Fee Type-wise analytics to identify areas of strength and concern, enabling data-driven financial strategy development.
- Use the Academic Year filter to perform historical analysis and identify long-term trends that inform strategic financial planning and forecasting.
- Focus on the Payment Summary table to prioritize collection efforts and develop targeted communication strategies for different student payment categories.
Common Issues & Solutions
| 🔴 Issue | ✅ Solution |
|---|---|
| Dashboard shows no data after applying filters | Verify that the selected filter combination has available data, try selecting broader filter criteria |
| Payment status metrics show inconsistent totals | Confirm payment processing completion and system synchronization, refresh dashboard or contact administrator for transaction verification |
| Monthly trend charts display incomplete data | Check date range selection and ensure payment data entry is current, verify system connectivity for real-time updates |
| Scholarship amounts do not match financial records | Verify scholarship disbursement processing and cross-reference with accounts department for payment reconciliation |
| Data inconsistencies across different dashboard sections | Manual data entry processes and timing delays between different staff members updating related information can cause temporary mismatches - allow 15-30 minutes for system synchronization |
Implementing the Payment Dashboard creates a comprehensive financial intelligence system that transforms institutional payment data into actionable insights for strategic decision-making and operational efficiency. By providing real-time financial metrics, interactive filtering capabilities, sophisticated data visualizations, and detailed payment status analytics, this dashboard enables financial administrators to monitor collection performance, identify trends, and make informed decisions that optimize revenue collection and student financial management. The system's interactive hover functionality, comprehensive filtering options, and detailed payment categorization ultimately create a powerful financial management environment where data-driven decisions enhance institutional financial health, improve collection strategies, and support strategic planning initiatives that drive sustainable institutional growth and financial stability.